If you are preparing to lease a property, you may be wondering whether tenants have more alternatives nearby, or whether conditions have changed since you last checked.
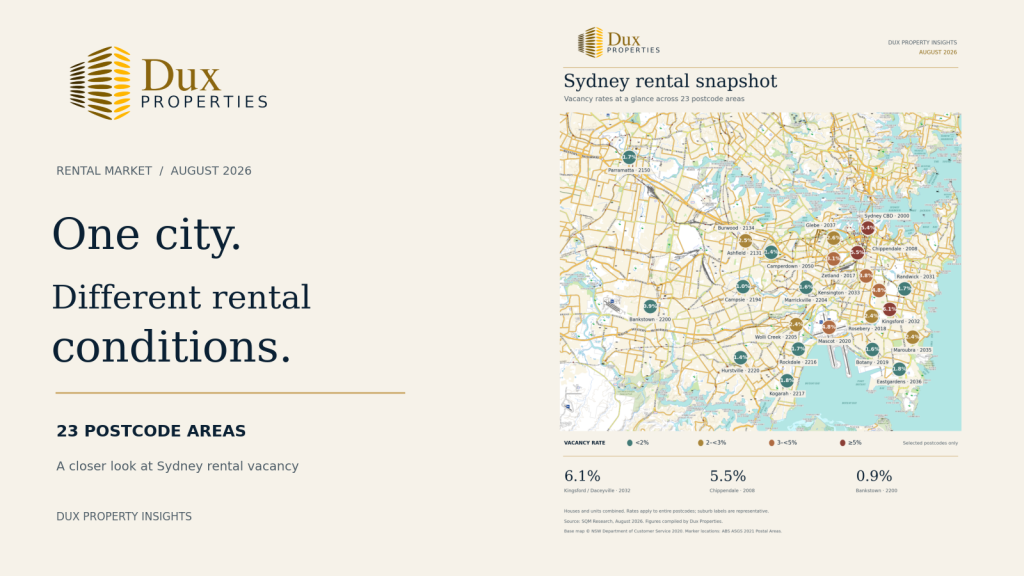
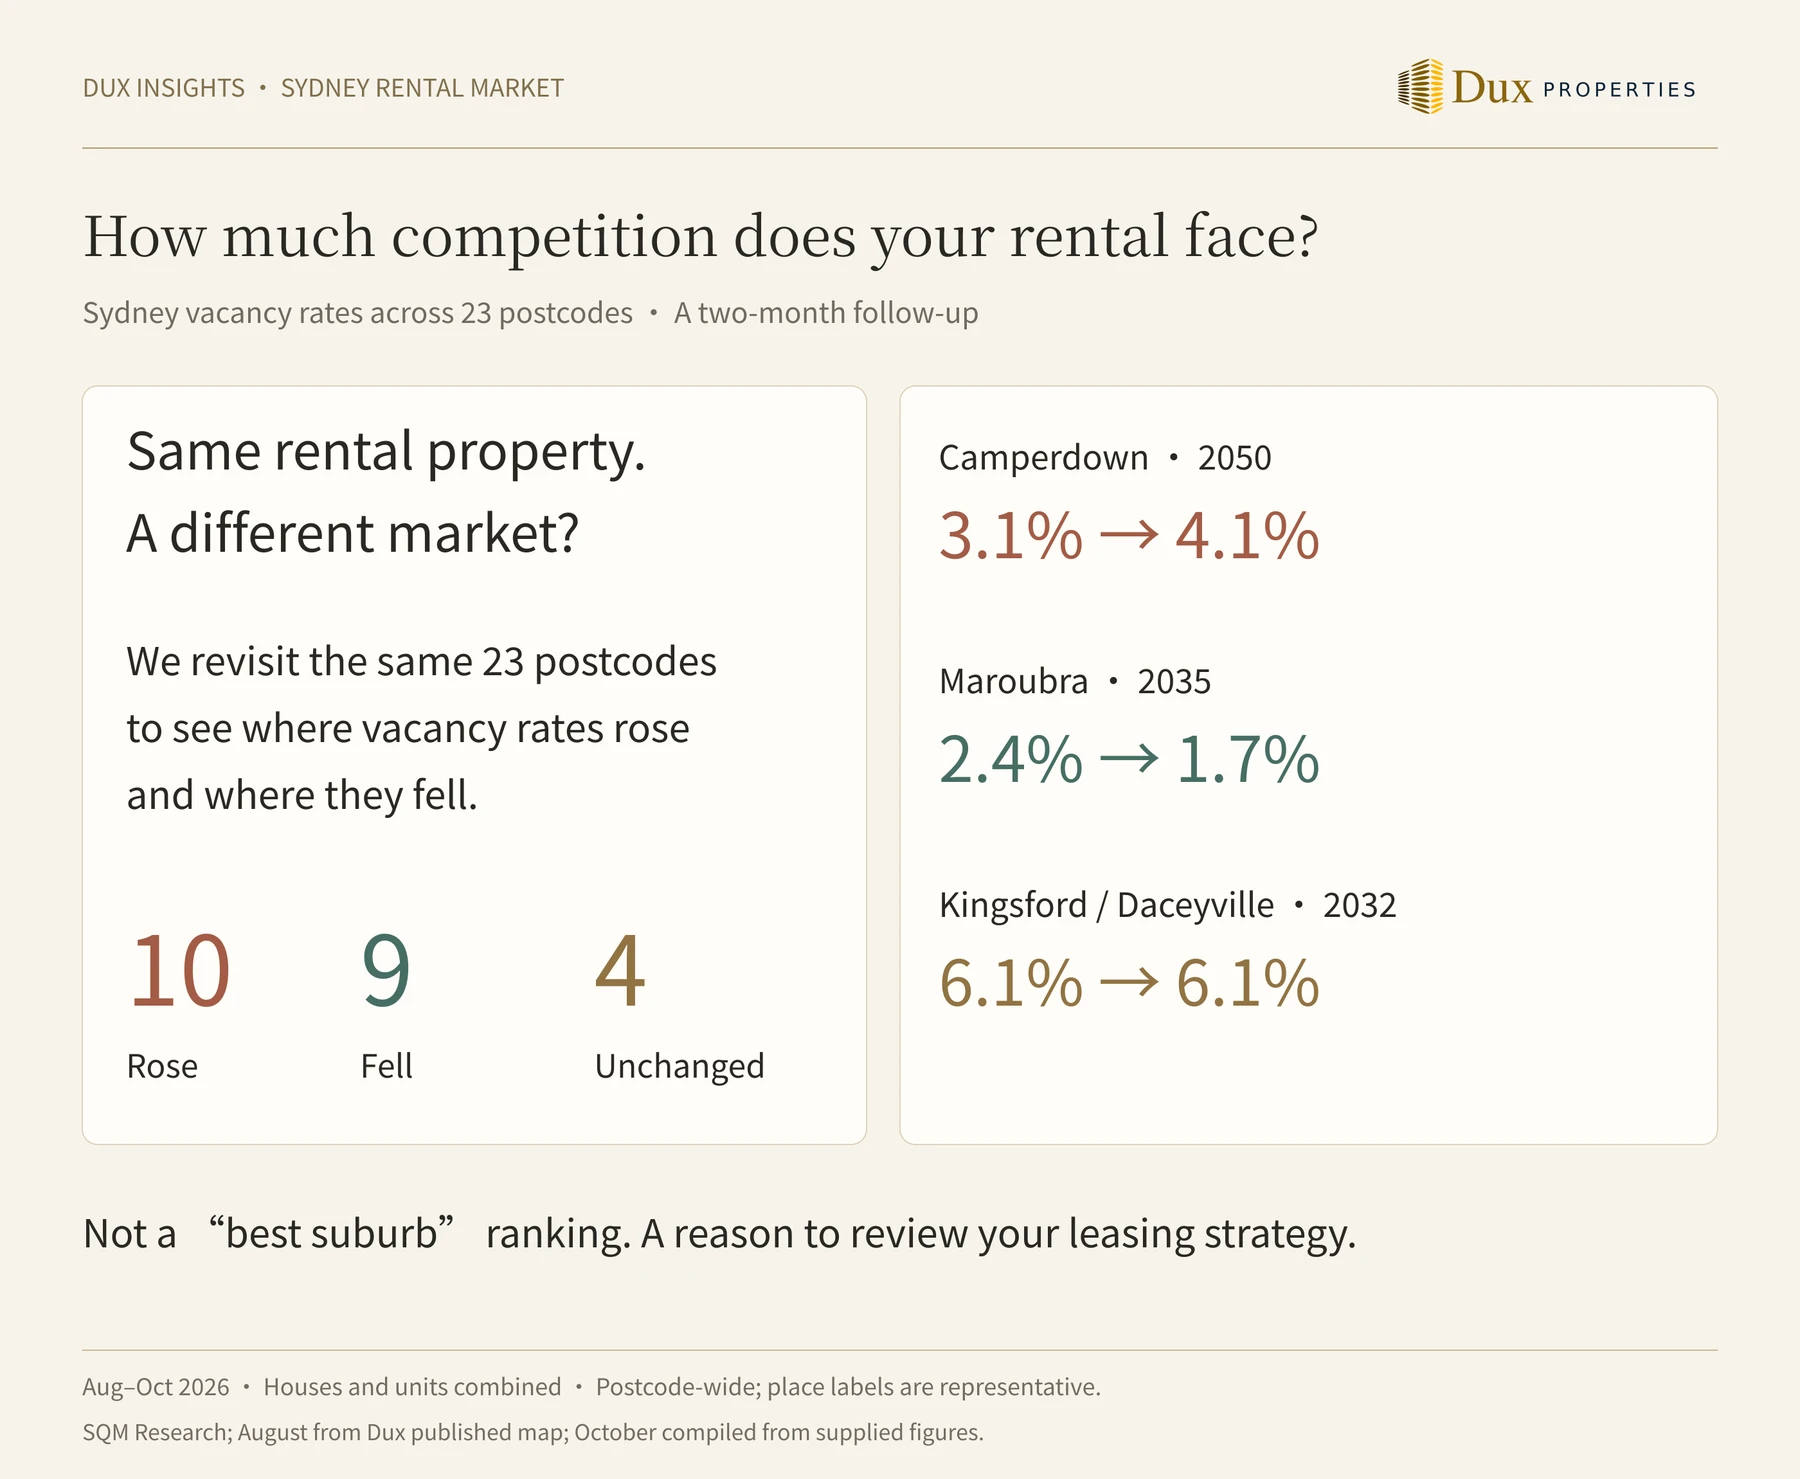
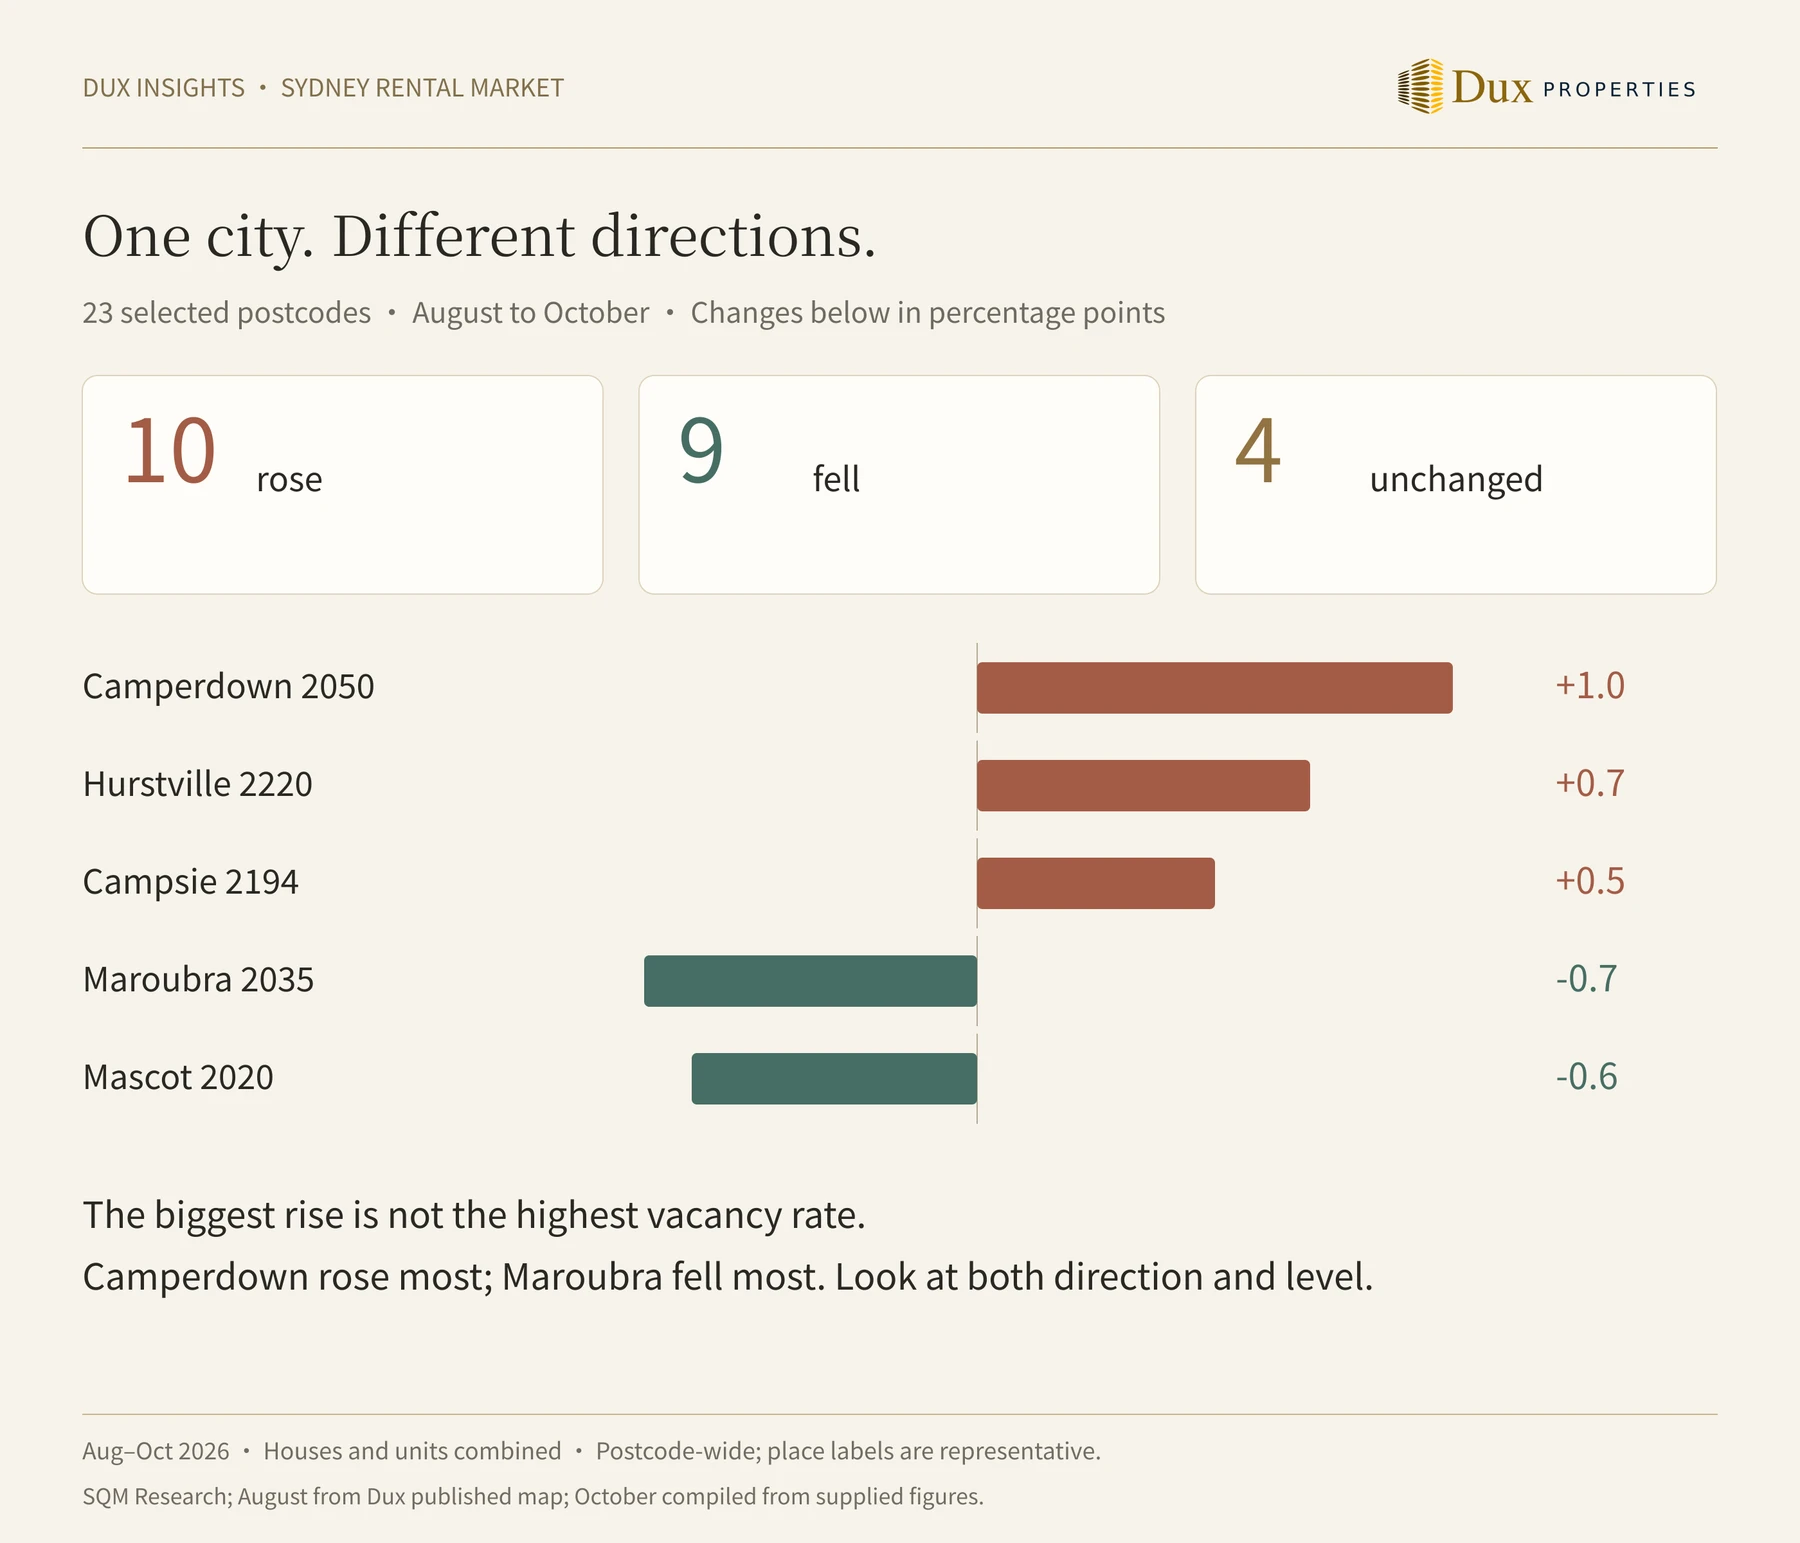
We revisited the same 23 Sydney postcodes covered in our August snapshot and compared their October vacancy rates. The picture is mixed: 10 increased, 9 decreased and 4 were unchanged.
The useful question is not simply which postcode has the lowest rate. It is how the rate has changed, where it stands now, and what that means you should investigate for your own property.
The biggest changes went in different directions
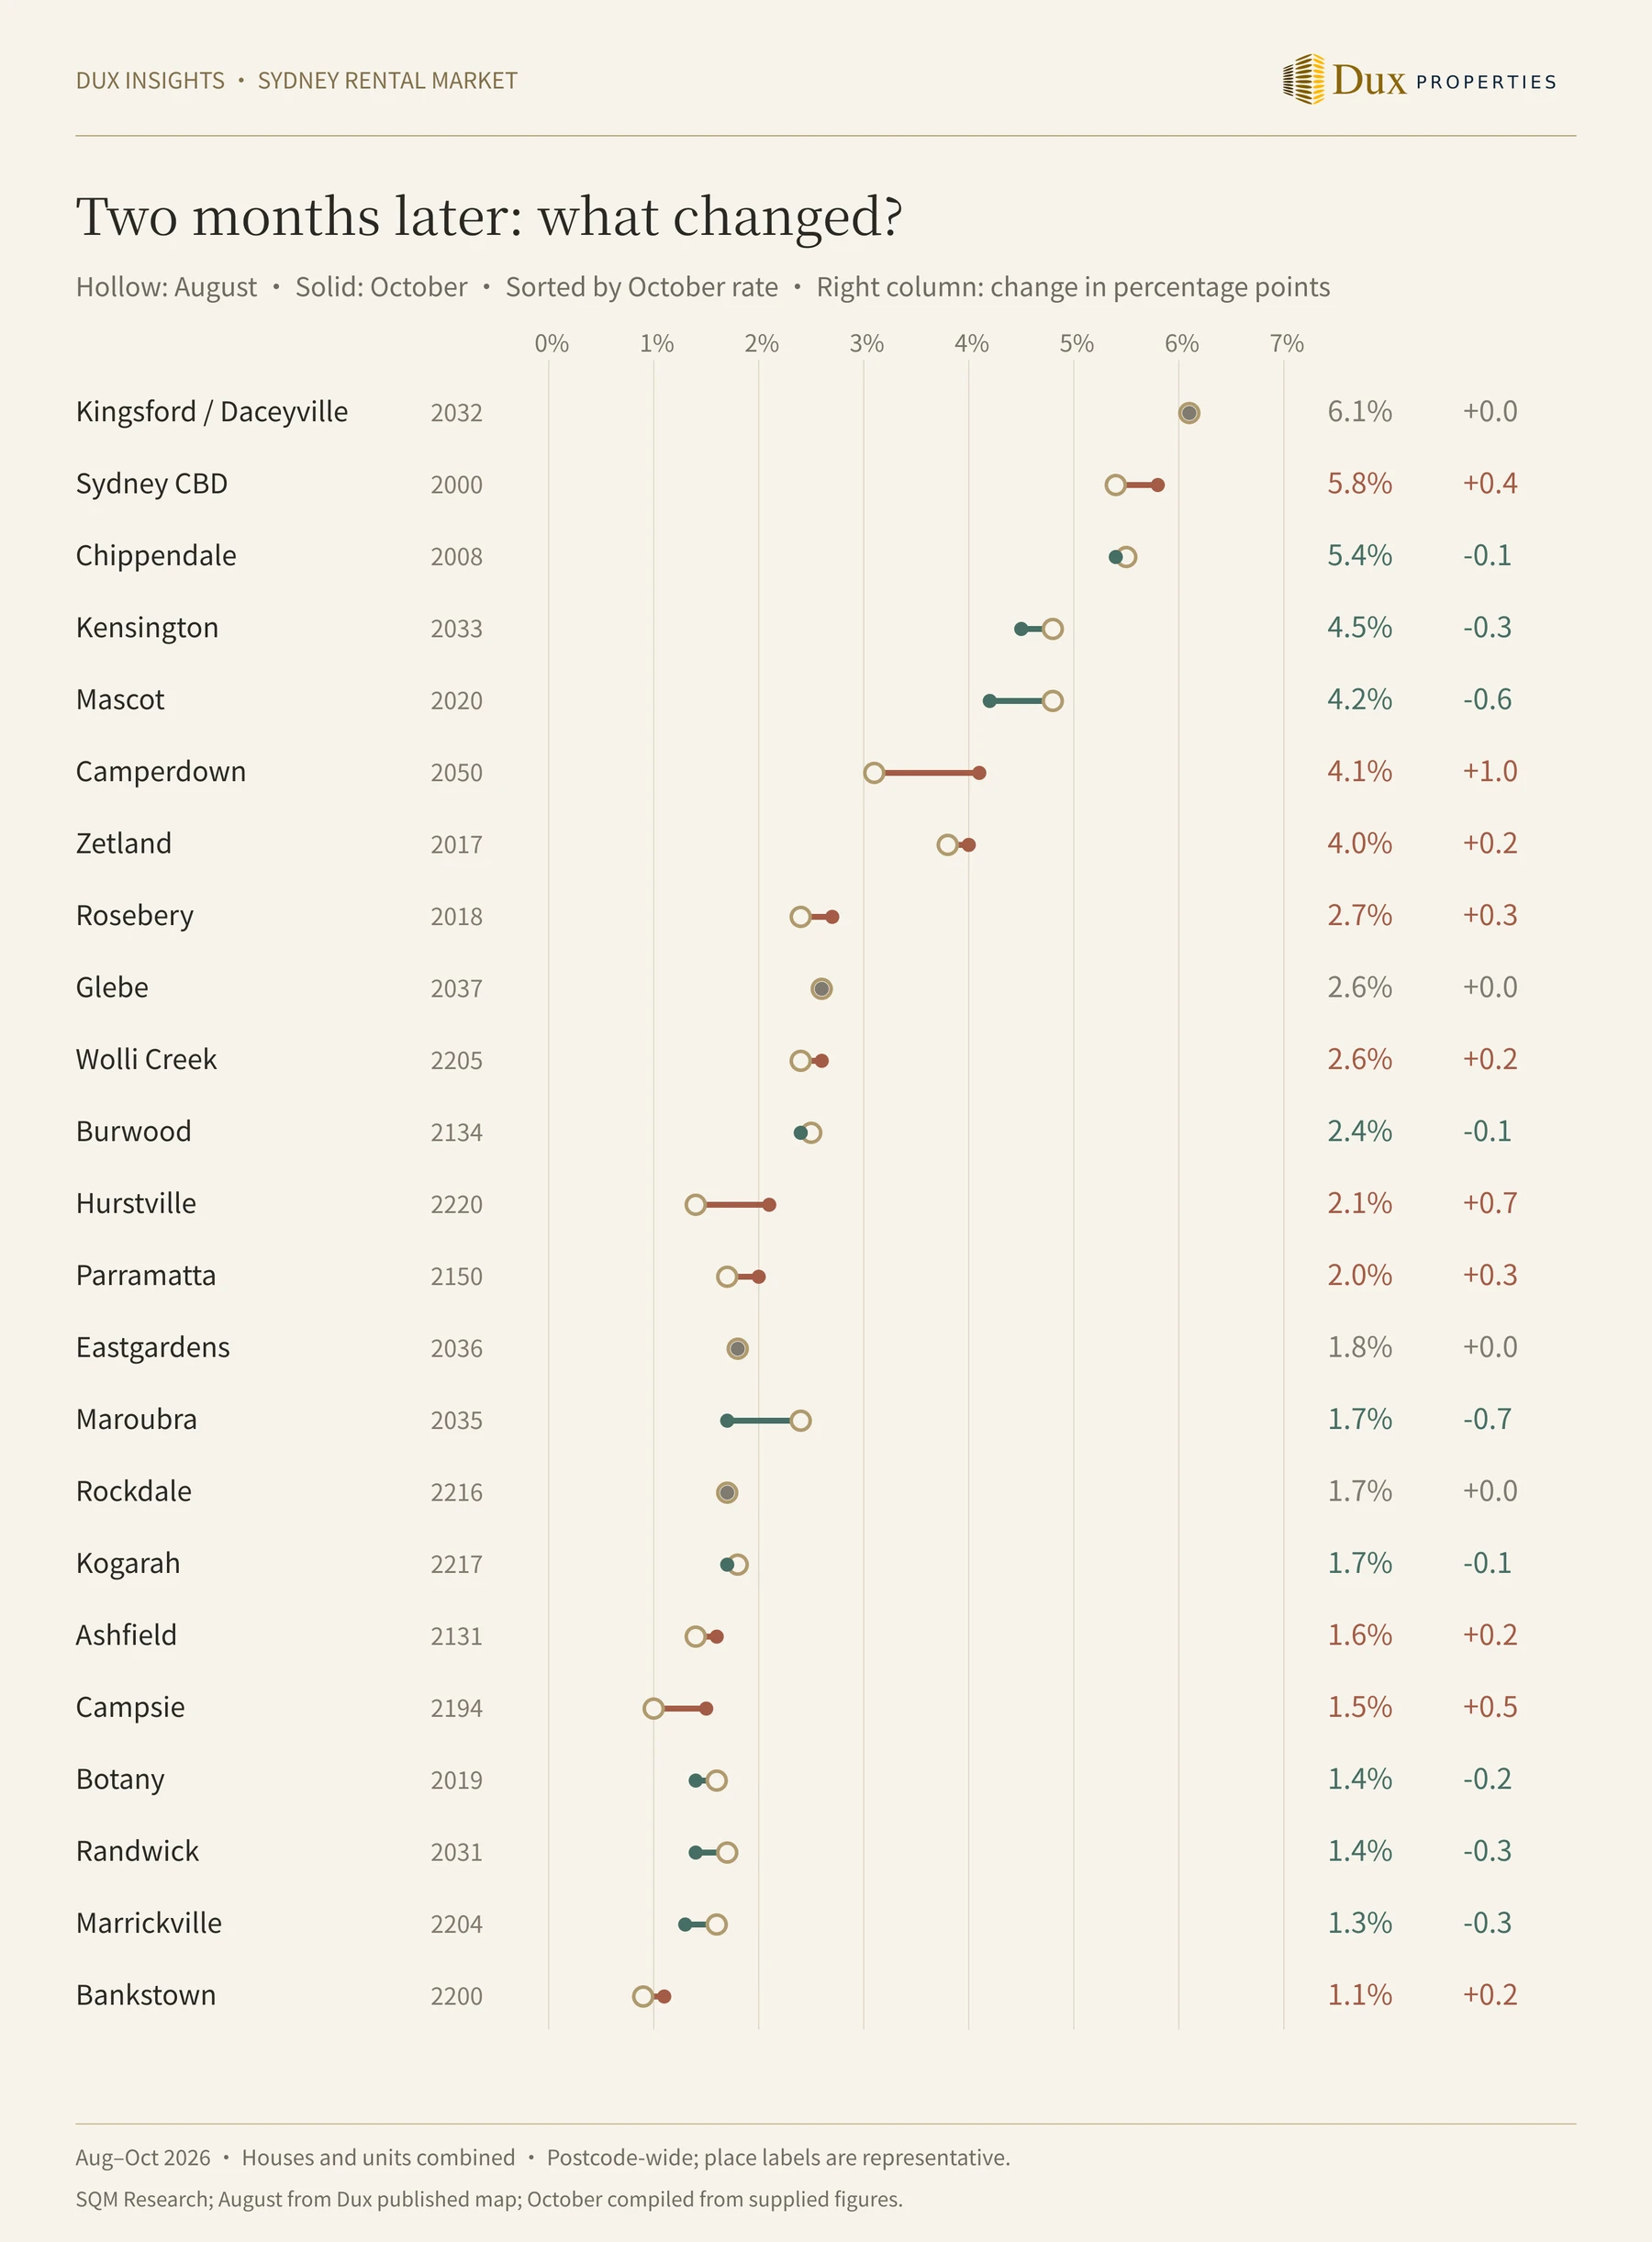
Postcode 2050, represented here by Camperdown, rose from 3.1% to 4.1%. Its increase of 1.0 percentage point was the largest in this selection. Postcode 2220 (Hurstville) rose from 1.4% to 2.1%, while 2194 (Campsie) increased from 1.0% to 1.5%.
Elsewhere, 2035 (Maroubra) fell from 2.4% to 1.7%, a decrease of 0.7 percentage points. Postcode 2020 (Mascot) declined from 4.8% to 4.2%, down 0.6 percentage points.
For owners planning a leasing campaign, these changes are a reason to review today’s competing listings rather than rely on an assessment made two months ago. A higher vacancy rate does not mean every property is harder to lease; a lower rate does not guarantee a quicker result for yours.
A falling rate does not tell the whole story
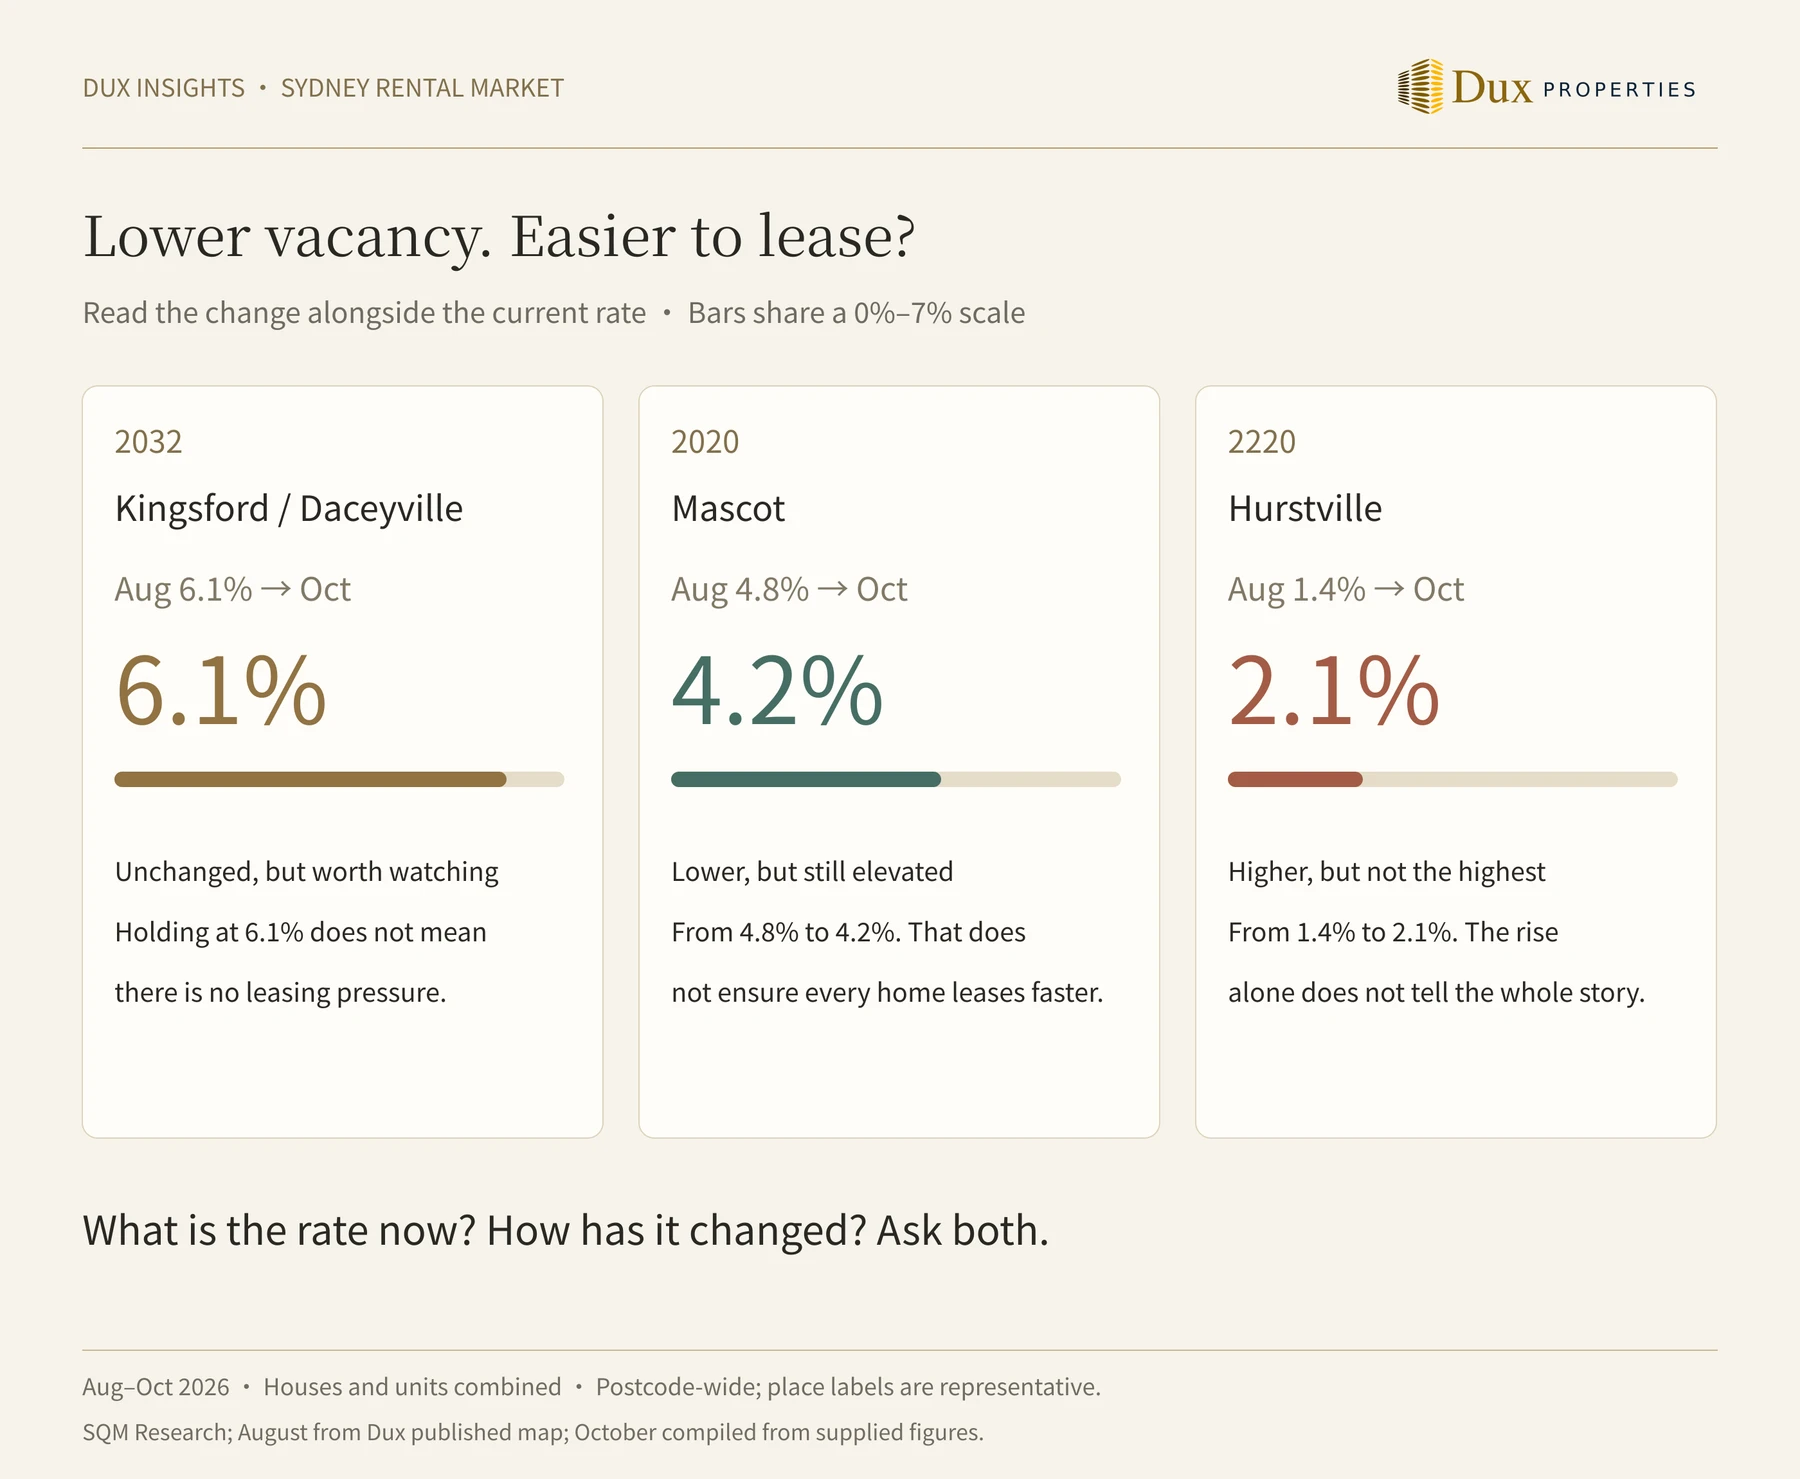
Mascot’s 2020 postcode fell by 0.6 percentage points, but its October rate was still 4.2%. Bankstown’s 2200 postcode rose by 0.2 percentage points to 1.1%.
One moved down and the other moved up, yet their current levels remain quite different. That is why the direction of change and the current rate need to be considered together.
Among these 23 postcodes, the highest October rates were 2032 (Kingsford / Daceyville) at 6.1%, 2000 (Sydney CBD) at 5.8% and 2008 (Chippendale) at 5.4%. These figures warrant a closer look at comparable properties, but they do not directly describe the competition facing a particular building, dwelling type or individual home.
Unchanged does not mean nothing needs reviewing
The displayed rates for 2032, 2037, 2216 and 2036 remained at 6.1%, 2.6%, 1.7% and 1.8%, respectively.
“Unchanged” means the two published figures, rounded to one decimal place, are the same. It does not establish that there were no movements between the two months, or that listings, tenant choices and individual property outcomes stayed the same.
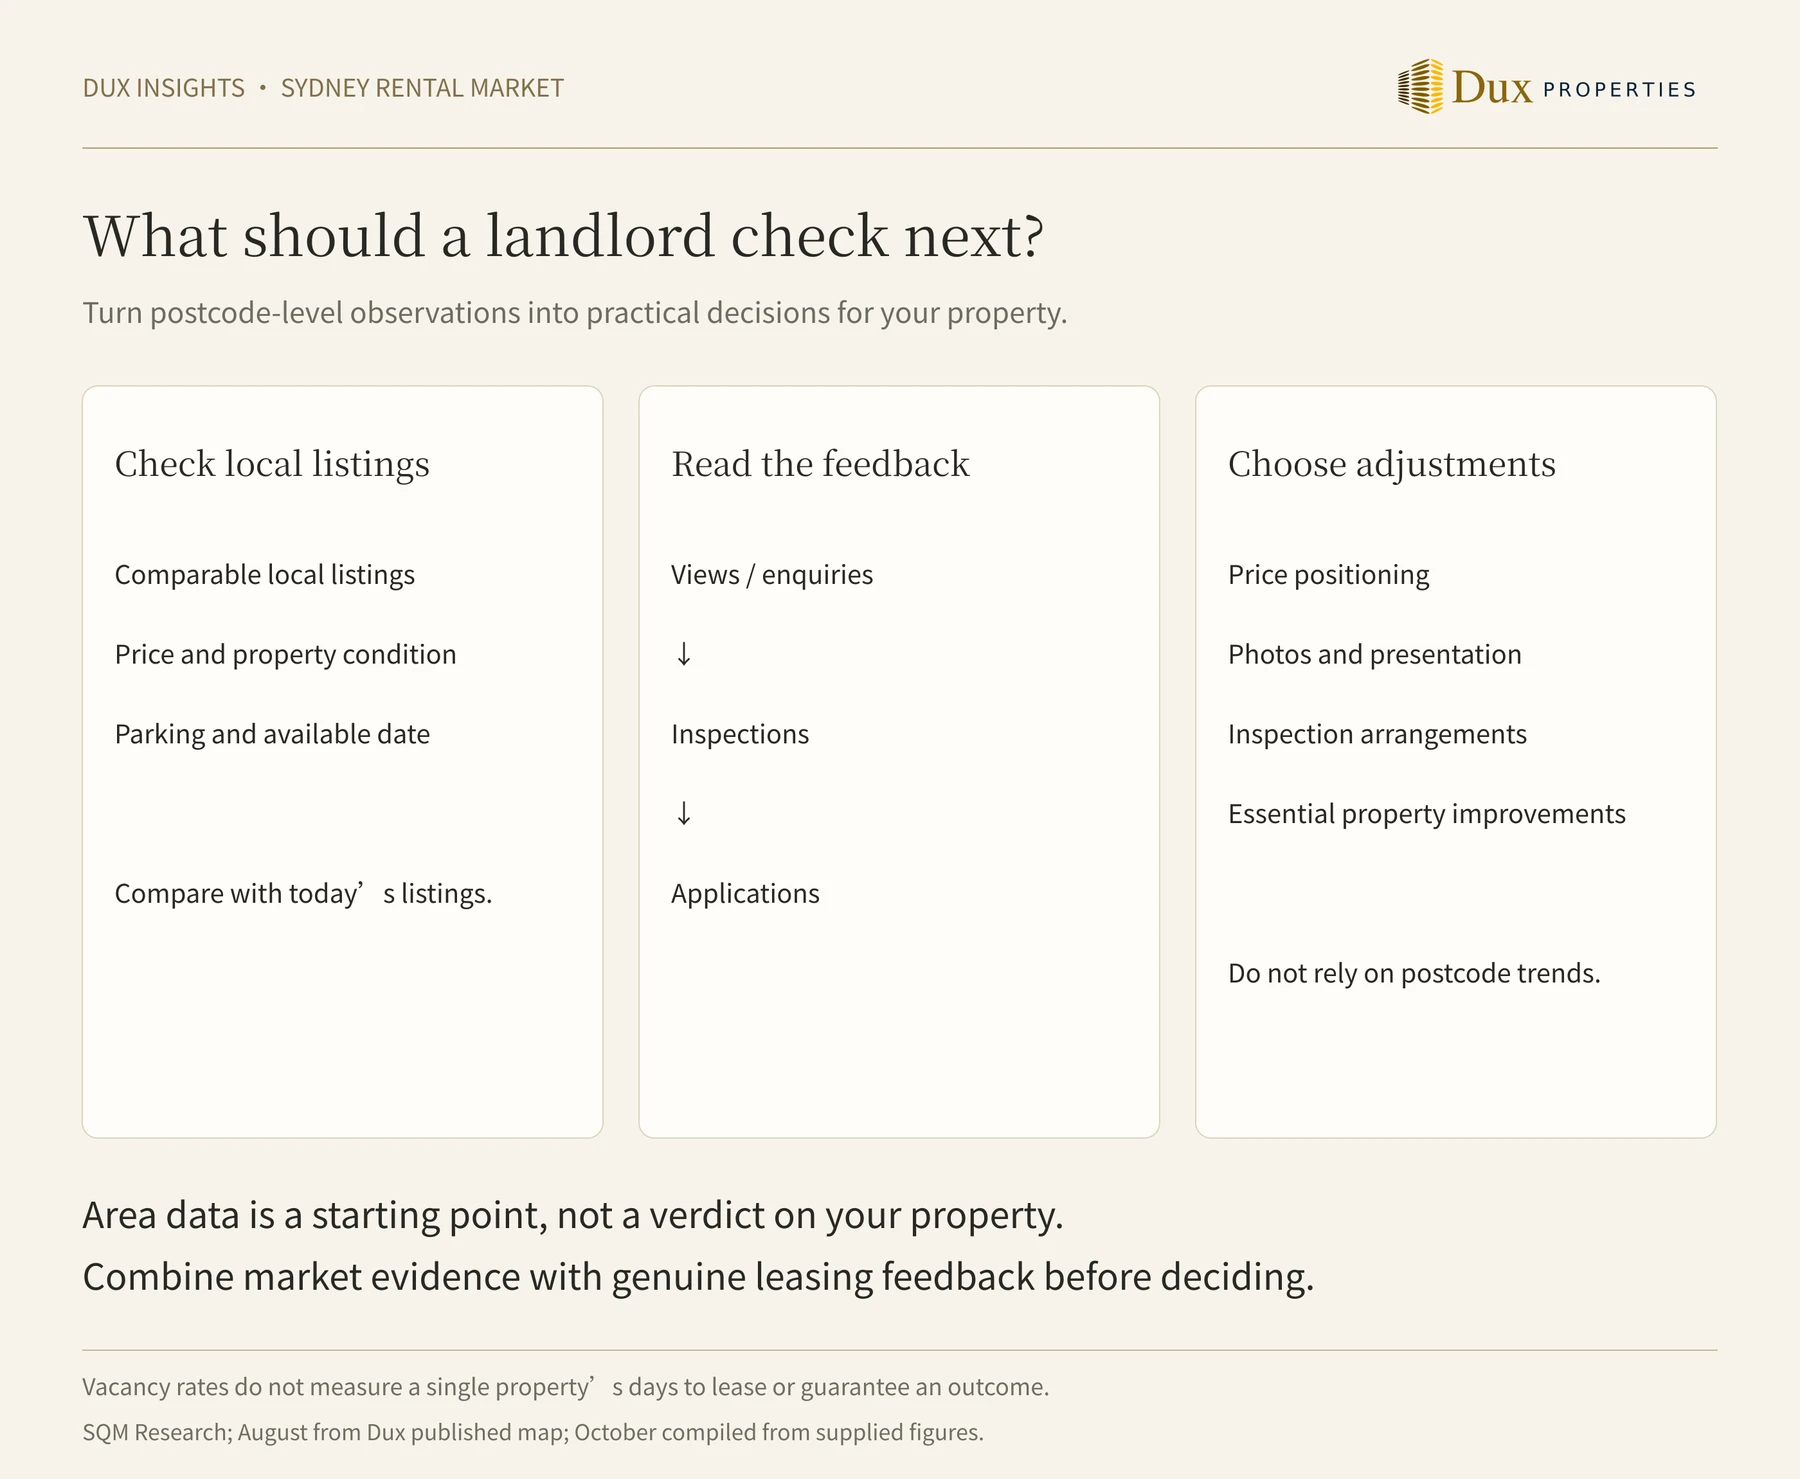
Within a postcode, dwelling type, building age, transport access, parking and property condition can all differ. After reviewing the broader figures, return to listings that are genuinely comparable with your property.
How owners can use this comparison
If you are about to list: compare properties with a similar location, dwelling type and features. Consider what else tenants can choose at the same budget, then review your pricing, photographs, presentation and inspection arrangements.
If your property is listed but response is weak: look separately at listing views, enquiries, inspection attendance and applications. Identify where interest drops off before deciding what to change. A postcode vacancy rate alone is not a reason to change the asking rent.
If an existing tenancy is running smoothly: use these figures as background for your next leasing or rent assessment, rather than converting a vacancy-rate change into a rent increase. Any changes to an existing tenancy must be considered separately against the agreement and applicable requirements.
A reason to reassess, not a ranking of the best places to rent out
The value of this follow-up is not a promise that one postcode will be easy to lease in. It is a chance to check whether an earlier impression of the market still holds.
At Dux Properties, the focus is not just the percentage attached to a postcode. It is how your property should be presented, how its leasing campaign should be organised, and which responses call for timely attention.
Preparing to lease, or wondering what your property is competing against? Talk to Dux Properties about applying the market context to your own property.
All 23 postcodes at a glance
| Postcode | Representative area | August | October | Change (pp) |
|---|---|---|---|---|
| 2000 | Sydney CBD | 5.4% | 5.8% | +0.4 |
| 2008 | Chippendale | 5.5% | 5.4% | -0.1 |
| 2017 | Zetland | 3.8% | 4.0% | +0.2 |
| 2018 | Rosebery | 2.4% | 2.7% | +0.3 |
| 2019 | Botany | 1.6% | 1.4% | -0.2 |
| 2020 | Mascot | 4.8% | 4.2% | -0.6 |
| 2031 | Randwick | 1.7% | 1.4% | -0.3 |
| 2032 | Kingsford / Daceyville | 6.1% | 6.1% | 0.0 |
| 2033 | Kensington | 4.8% | 4.5% | -0.3 |
| 2035 | Maroubra | 2.4% | 1.7% | -0.7 |
| 2036 | Eastgardens | 1.8% | 1.8% | 0.0 |
| 2037 | Glebe | 2.6% | 2.6% | 0.0 |
| 2050 | Camperdown | 3.1% | 4.1% | +1.0 |
| 2131 | Ashfield | 1.4% | 1.6% | +0.2 |
| 2134 | Burwood | 2.5% | 2.4% | -0.1 |
| 2150 | Parramatta | 1.7% | 2.0% | +0.3 |
| 2194 | Campsie | 1.0% | 1.5% | +0.5 |
| 2200 | Bankstown | 0.9% | 1.1% | +0.2 |
| 2204 | Marrickville | 1.6% | 1.3% | -0.3 |
| 2205 | Wolli Creek | 2.4% | 2.6% | +0.2 |
| 2216 | Rockdale | 1.7% | 1.7% | 0.0 |
| 2217 | Kogarah | 1.8% | 1.7% | -0.1 |
| 2220 | Hurstville | 1.4% | 2.1% | +0.7 |
Reading the data
The comparison covers August and October 2026 for the same selected 23 postcodes as the original article, not the whole Sydney market. SQM Research vacancy figures combine houses and units and apply to entire postcodes. Suburb names are representative labels, not separate suburb-level statistics.
Changes are October minus August, expressed in percentage points. For example, 3.1% to 4.1% is an increase of 1.0 percentage point, not 1%. Figures are shown to one decimal place; unchanged means the displayed values match. This article does not establish the causes of the changes or guarantee leasing times, rental income or investment outcomes.
Source: SQM Research. August figures were checked against Dux’s published map. October figures were compiled by Dux from the supplied SQM figures and were not independently retrieved for verification.
Owner Takeaway
Look at both the current vacancy rate and its direction of change. Compare genuinely similar listings, then use enquiries, inspections and applications to decide whether pricing, presentation or inspection arrangements need attention. Postcode data is a starting point, not a forecast for an individual property.